Table of Contents
Coins, wallets and the tale of very big numbers
It’s hard to miss the tidal wave of stories about cryptocurrency. The inexorable rise of BitCoin, Ethereum, and a whole stable of others, and the volatility where fortunes are made – and lost – has ensured it is the hot technical topic of the day. You can even apparently soon pay for a Tesla with cryptocurrency. In this article, we’ll use Windows Ui Toolkit for charts, graphs, bars, and VCL Styles to visualize that volatility by plotting the ups and downs of various virtual cryptocurrencies against good old hard cash. It’s surprisingly easy to do!
Charts, graphs and bars
In this article, we are going to use Steema TeeChart for the charting functions. The RAD Studio Delphi VCL framework comes with a built-in TeeChart Std. It doesn’t have some of the additional bells and whistles of the TeeChart Pro version, but it’s enough to produce some really functional examples.
For other platforms such as Firemonkey TeeChart Lite is provided, but it has a few features that aren’t included which we would for our purposes. To overcome this, you can install the Teechart Pro trial version from https://www.steema.com. The trial versions are fully functional with the only limitation that a small nag screen appears when you first run them.
Where are we going to get the cryptocurrency data from?
We’re going to use the TFDMemTable ExchangeMemTable components to provide the data to the charts. This table contains three fields:
- Date
- USD_BTC (USD for one Bitcoin)
- USD_ETH (USD for one Ethereum)
At runtime, we can retrieve actual data from the Web, or load it from some predefined files.
At design time, the table comes with 12 records – last year per month.
More details about the table filling see below.
Creating our cryptocurrency chart
Create a blank VCL form and drop TDBChart on it:

Click with your right mouse and select “Edit Chart”:

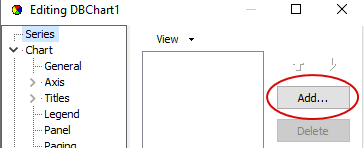
On “Series”, select “Add”

Now select “Bar” and press “OK”

We have a sample chart!
A sample TeeChart bar appears. Now, expand “Series”, select “Series1”, choose “Data Source” and select “Dataset”

Select ExchangeMemTable, Date for X, USD_BTC for Bar. Press the “Apply” button.
Our 12-month data appears.

Tidying some loose ends
For this task, probably, we do not need Legend. Uncheck Visible for it:

Probably, we do not need also marks, left axis is enough. Uncheck “Visible” for them:

Trying out other charts
We can easily select another chart style for the same data. Press “Change” for Series1:

Now, select “Line”

Adding additional cryptocurrencies to our VCL chart example
Now, let us add another cryptocurrency. In “Series”, press Add:

Choose “Line”. For Series2, select “Dataset” – ExchangeMemTable, Date for X, USD_ETH for Y and then press “Apply” to make the chart sprint into life.

Adjusting for cryptocurrency variations on the example VCL chart
Ethereum (ETH) values are significantly smaller than BitCoin (BTC). To improve the scaling and provide a better comparison let’s expand “ETH” to a full chart size. Let us give ETH a separate axis on the right side:

How to fetch live cryptocurrency data into our VCL chart example

To fill the ExchangeMemTable with actual rates from the currency exchange, you should get a free key from https://coinlayer.com/. Enter this key in the editor field. Select an appropriate time period (last year, last month, last week) and step (month, week, number of days) and then choose “Fill from network”.
Data operations are placed in a modal dialog. To invoke it, press “Data manipulation” in the main form.
How do we get the data?
The networking code is located in a separate data module. This code comes from the Embarcadero blog article Automate Access To Current And Historical Currency Exchange Rates Via API, with some small modifications. Look in the data module of the example code where the exact process is explained in the code comments.
Get the full working example code here on GitHub.
Learn about the C++ vector erase method of wstring and how you can solve 5 diagonal matrix forms.
Are you ready to chart the white-knuckle rollercoaster ride of cryptocurrencies in your Windows applications?
Design. Code. Compile. Deploy.
Start Free Trial Upgrade Today
Free Delphi Community Edition Free C++Builder Community Edition


